ASCII maps of vector files
ʕ•ᴥ•ʔ
I recently came across a nice python package for visualising vector data quickly. Of course, an obvious option is to fire up QGIS but often I generate these on a remote server so would like something a little more “text-based”… Then this post highlighted some rather charming tools for generating ASCII rasterisations of vector geometries. I liked the look of the python-based gj2ascii the most.
In my case, I was conducting lots processing on shapefiles containing mapped perimeters of wildfires. I wanted to just image the extent of the area considered by the data and the wildfire perimeters. Using gj2ascii visualising the result is, actually, extremely easy:
import fiona
import gj2ascii
asc = []
with fiona.open('fire_perimeters.shp') as poly:
    b0 = poly.next()
    asc.append(gj2ascii.render(b0, 100, char='.', fill=' ',bbox=poly.bounds))
    for shp in poly:
        if shp['properties']['Category']==2:
            # is really a burn
            asc.append(gj2ascii.render(shp, 100, char='+', fill=' ',bbox=poly.bounds))
# stacking operation
stacked = gj2ascii.stack(asc, fill=' ')
print(stacked)
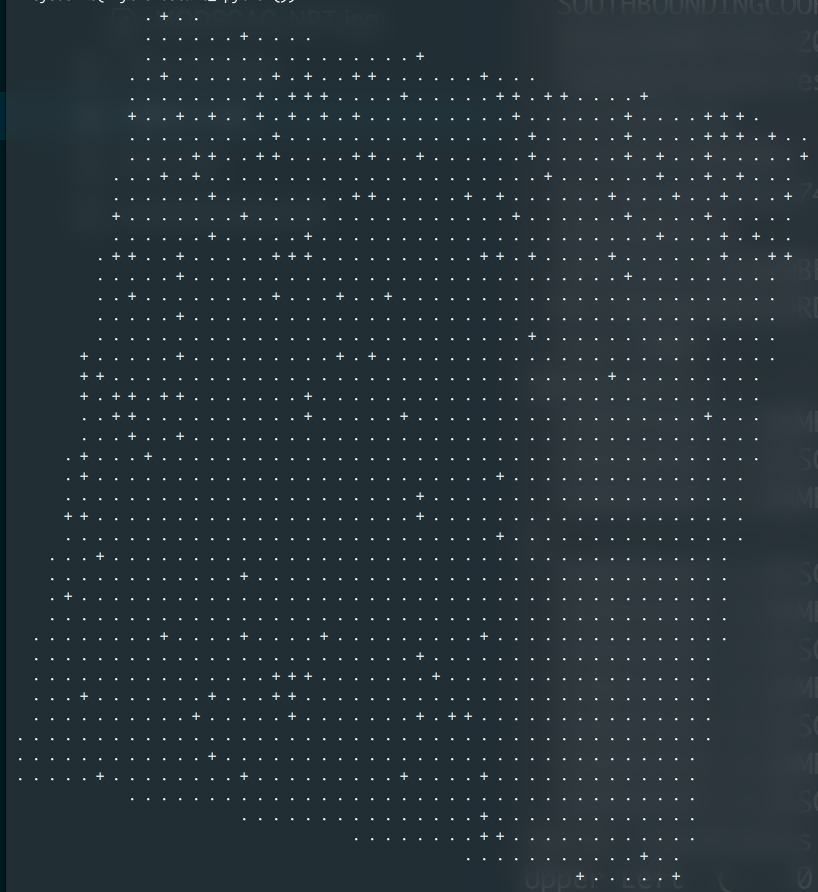
Okay, it works! gj2ascii also has some nice options to ‘modernize’ the ASCII to be a little less 70s FORTRAN readout, however. One is the simple addition of a colour map which switches the characters for blocks of colour.
# Choose colour map
colormap = {
    '+': 'red',
    '.': 'blue',
}
print(gj2ascii.style(stacked, colormap))
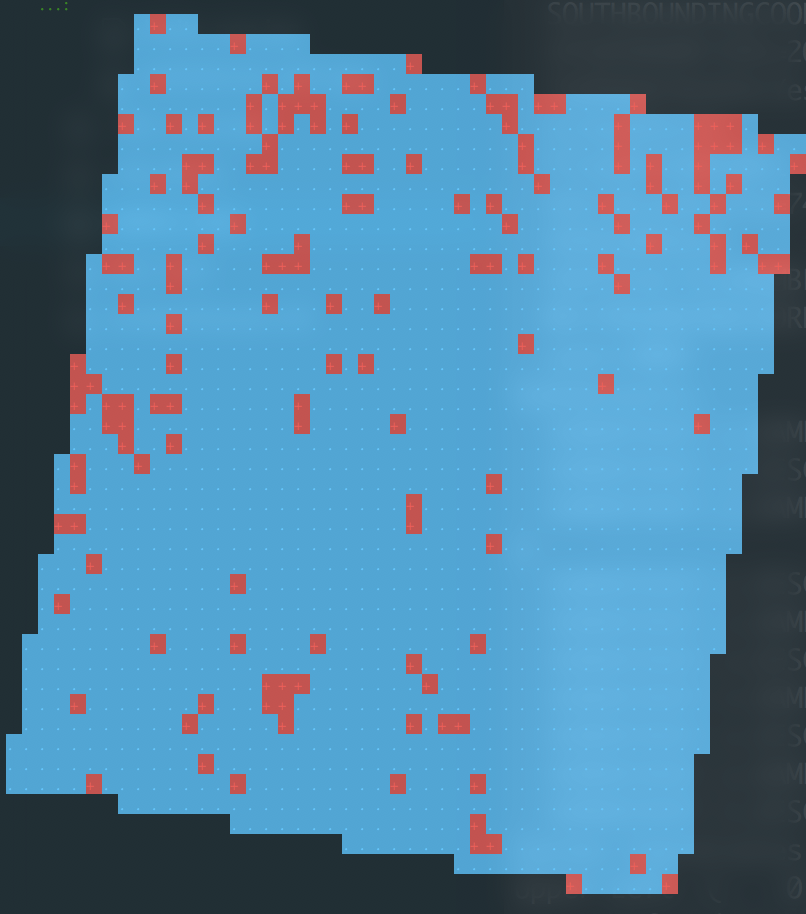
Which is already considerably more visually informative. And of course, if you really must:
# Choose colour map
colormap = {
    '+': ':fire:',
    '.': ':herb:',
}
print(gj2ascii.style(stacked, colormap))
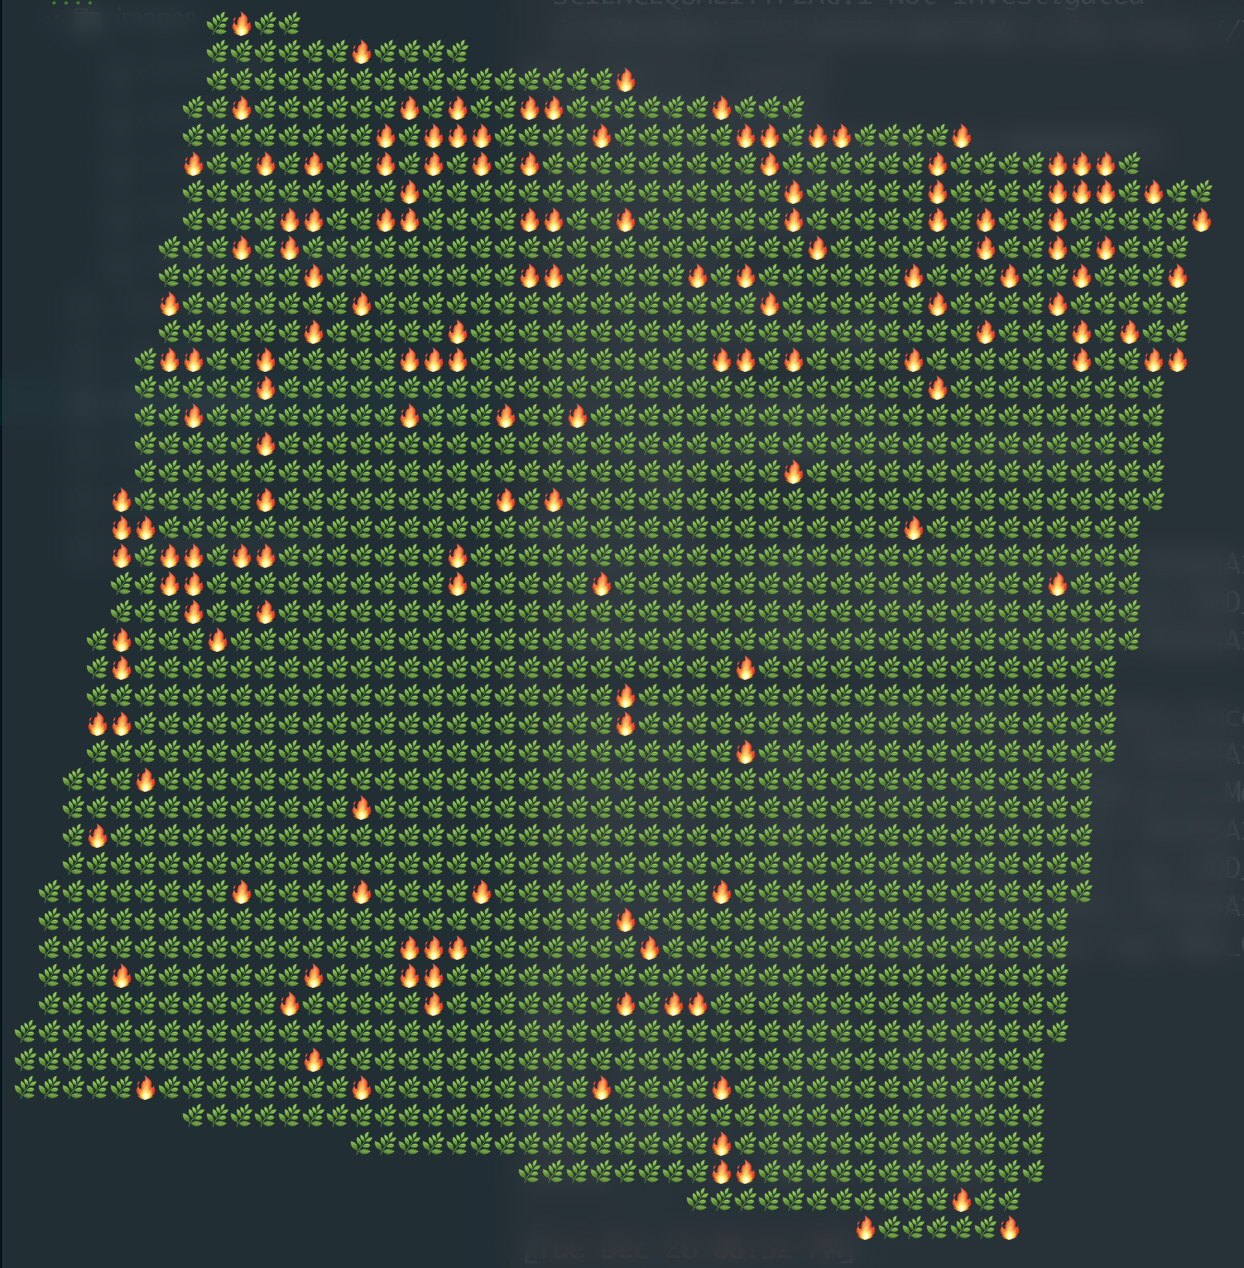
Note for the emojis you need the emojis package.